As written by the Real Estate Board Of Greater Vancouver. Home sales registered in the Multiple Listing Service® (MLS®) in Metro Vancouver finished the year down 10 per cent, marking the lowest annual sales total in over twenty years.
The Greater Vancouver REALTORS® (GVR) reports that residential sales in the region totalled 23,800 in 2025, a 10.4 per cent decrease from the 26,561 sales recorded in 2024, and a 9.3 per cent decrease from the 26,249 sales in 2023.
Last year’s sales total was 24.7 per cent below the 10-year annual sales average (31,625). “This year was one for the history books,” said Andrew Lis, GVR’s chief economist and vice-president, data analytics. “Although the sales total was the lowest in over two decades, Realtors were still busy listing properties. Sellers brought the highest total of listings to market on record since the mid-1990s, eclipsing the previous record high in 2008 by a little over 1,000 listings.”
Properties listed on the MLS® in Metro Vancouver totaled 65,335 in 2025. This represents an 8.2 per cent increase compared to the 60,388 properties listed in 2024. This was 28.4 per cent above the 50,893 properties listed in 2023.
The total number of properties listed last year was 13.1 per cent above the region’s 10-year total annual average of (57,782).
Currently, the total number of homes listed for sale on the MLS® system in Metro Vancouver is 12,550, a 14.6 per cent increase compared to December 2024 (10,948). This is 34.8 per cent above the 10-year seasonal average (9,308).
“The forecast we put out last January noted a foreseeable downside risk, which while prescient, unfortunately materialized in 2025,” said Lis. “Specifically, we noted that trade tensions with the USA could negatively impact sales and prices, and this downside risk came to pass. The upshot, however, is that the negative impact of these trade tensions appears to be easing, and consumer sentiment has improved modestly over the second half of the year.”
The MLS® Home Price Index composite benchmark price for all residential properties in Metro Vancouver is currently $1,114,800. This represents a 4.5 per cent decrease over December 2024 and a 0.8 per cent decrease compared to November 2025.
“With sales down and inventory remaining plentiful, prices eased across all property types since the start of 2025. Sales and prices weren’t the only metrics that came down, borrowing costs fell nearly one full percentage point,” said Lis. “With lower prices, lower borrowing costs, and plenty of inventory to choose from, homebuyers in 2026 are starting the year with favorable conditions. Whether these conditions translate into a market with stronger demand will be the million-dollar question – and we’ll be monitoring this story closely as it unfolds.” December 2025 summary Residential sales in the region totaled 1,537 in December 2025, a 12.9 per cent decrease from the 1,765 sales recorded in December 2024. This was 20.7 per cent below the 10-year seasonal average (1,937).
There were 1,849 detached, attached and apartment properties newly listed for sale on the MLS® in Metro Vancouver in December 2025. This represents a 10.3 per cent increase compared to the 1,676 properties listed in December 2024. This was 10.3 per cent above the 10-year seasonal average (1,677).
Across all detached, attached and apartment property types, the sales-to-active listings ratio for December 2025 is 12.7 per cent. By property type, the ratio is 9.3 per cent for detached homes, 14.6 per cent for attached, and 15.1 per cent for apartments.
Analysis of the historical data suggests downward pressure on home prices occurs when the ratio dips below 12 per cent for a sustained period, while home prices often experience upward pressure when it surpasses 20 per cent over several months.
Sales of detached homes in December 2025 reached 431, a 12.8 per cent decrease from the 494 detached sales recorded in December 2024. The benchmark price for a detached home is $1,879,800. This represents a 5.3 per cent decrease from December 2024 and a 1.1 per cent decrease compared to November 2025.
Sales of apartment homes reached 791 in December 2025, a 11.2 per cent decrease compared to the 891 sales in December 2024. The benchmark price of an apartment home is $710,000. This represents a 5.3 per cent decrease from December 2024 and a 0.6 per cent decrease compared to November 2025.
Attached home sales in December 2025 totaled 303, an 18.3 per cent decrease compared to the 371 sales in December 2024. The benchmark price of a townhouse is $1,056,600. This represents a five per cent decrease from December 2024 and a 0.8 per cent decrease compared to November 2025. |


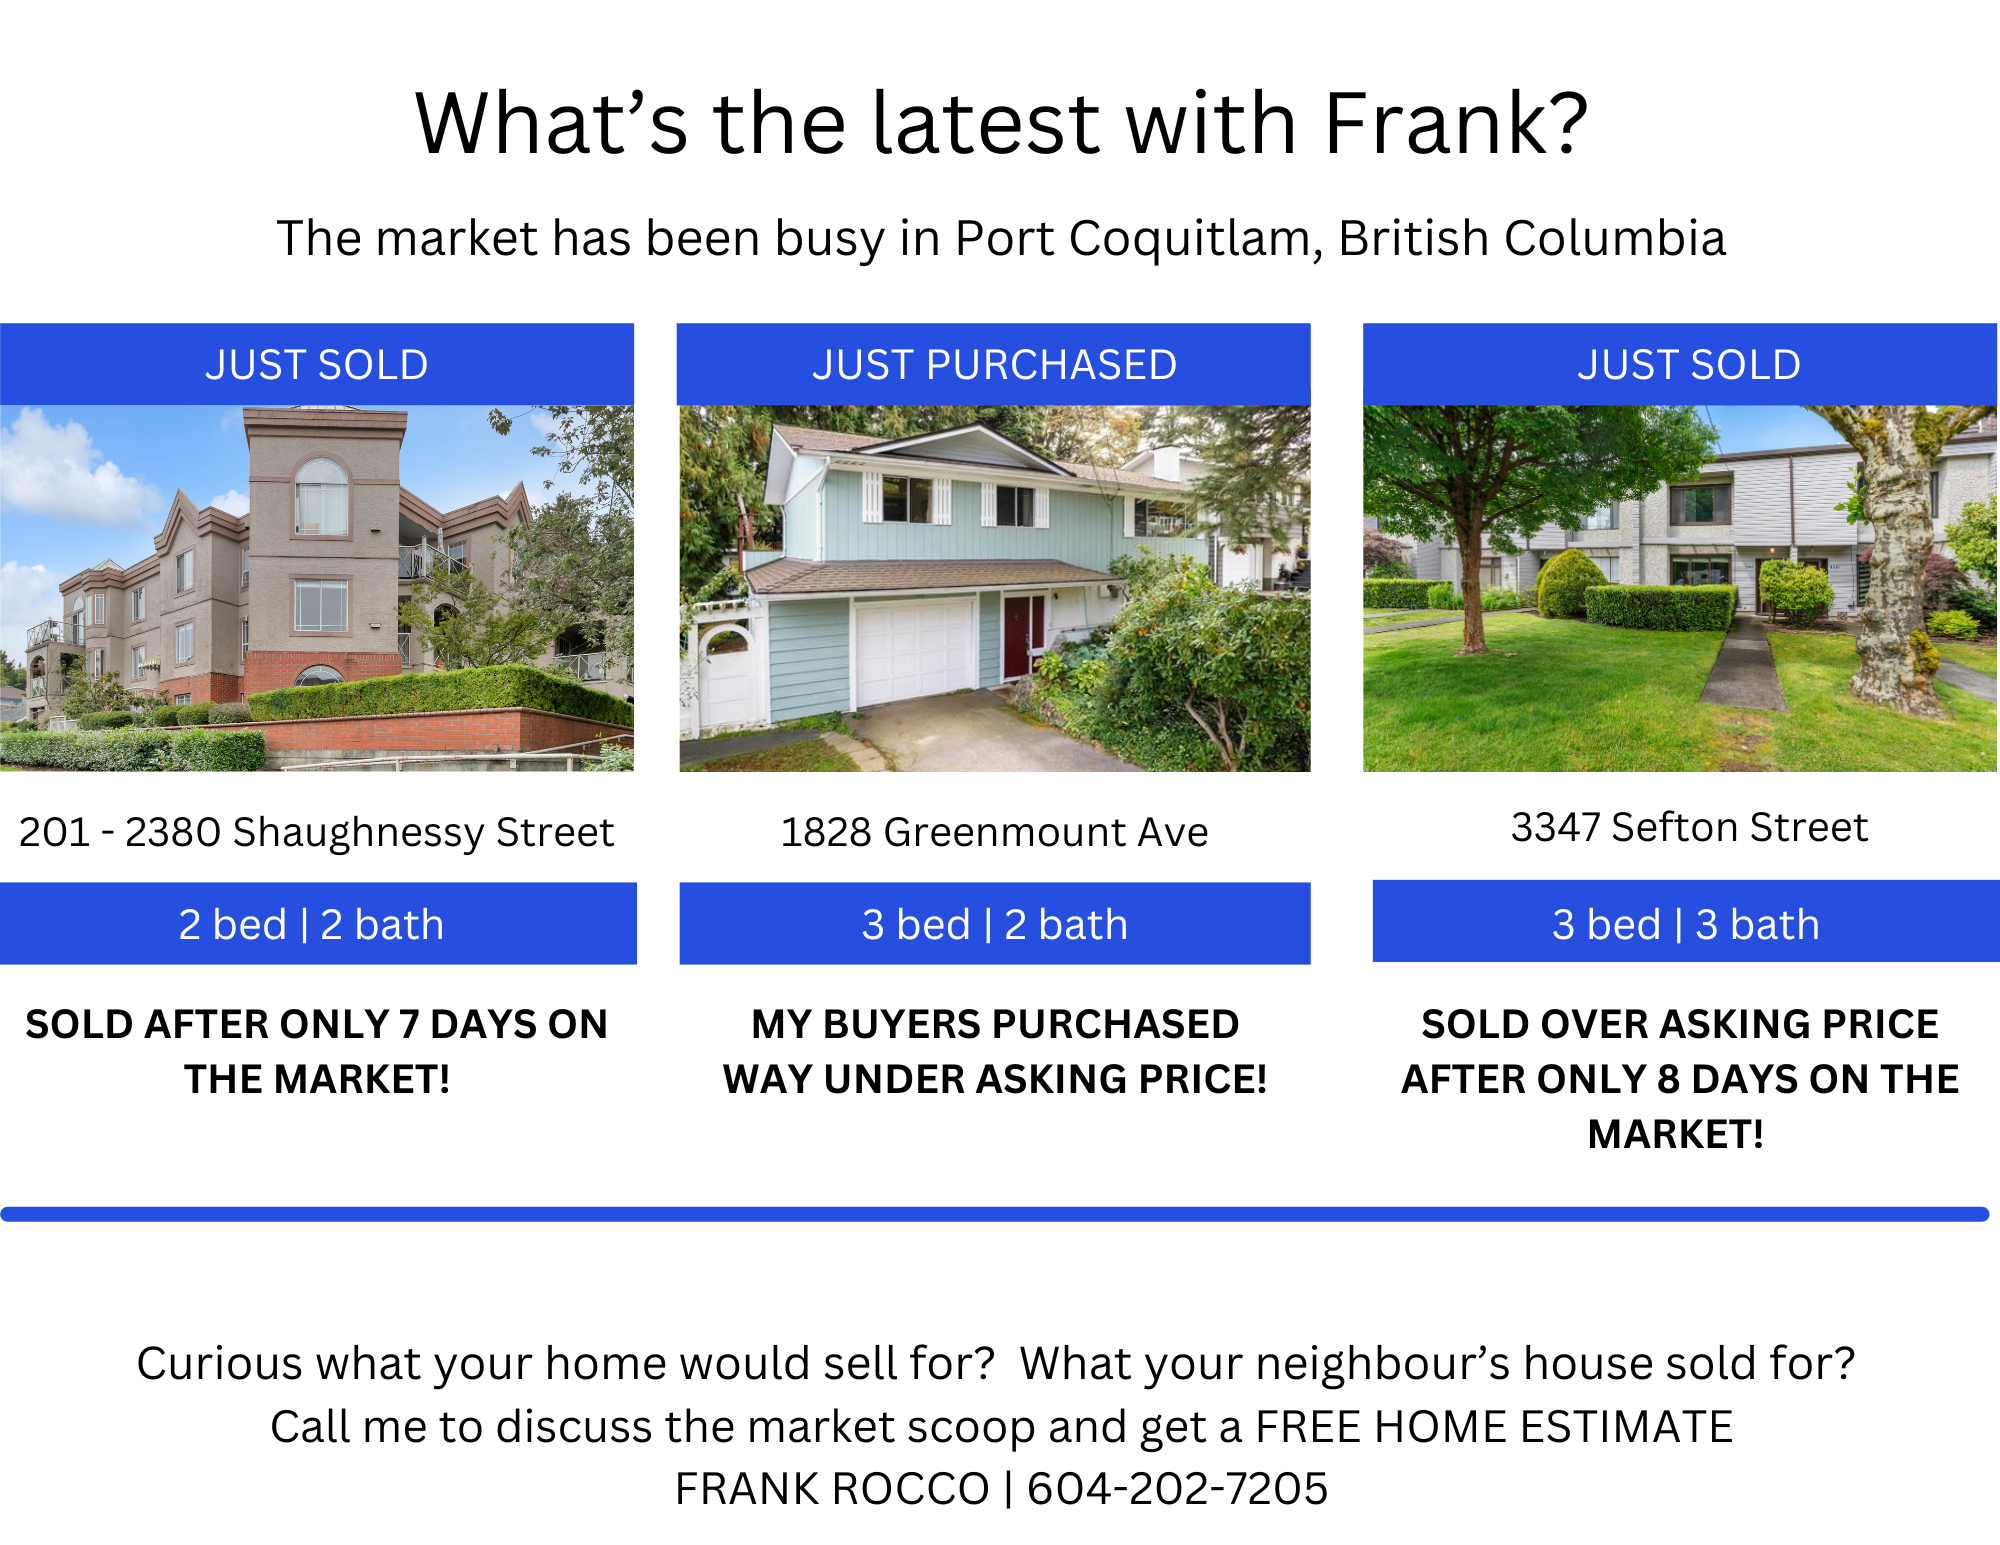


Your Trusted Partner in Real Estate. Contact us at 604-202-7205 for all your property needs.